
- Air cargo tonnages, spot rates and capacity from Asia Pacific all rose in the second week of September.
- Strong performance reported to be in part a rebound from national holidays the previous week in Vietnam and Malaysia.
- The latest figures maintain consistency within an otherwise mixed but relatively stable period for air cargo.
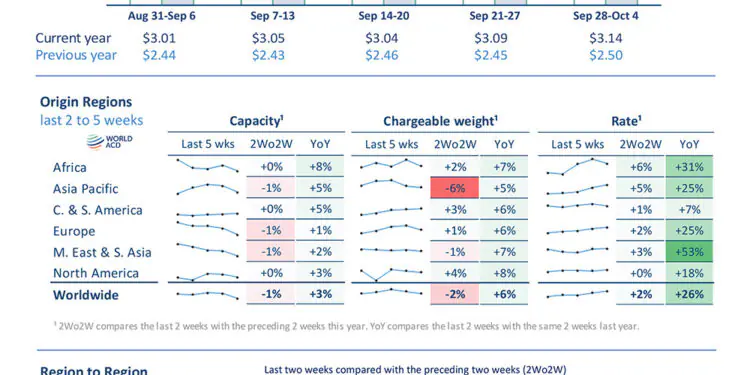
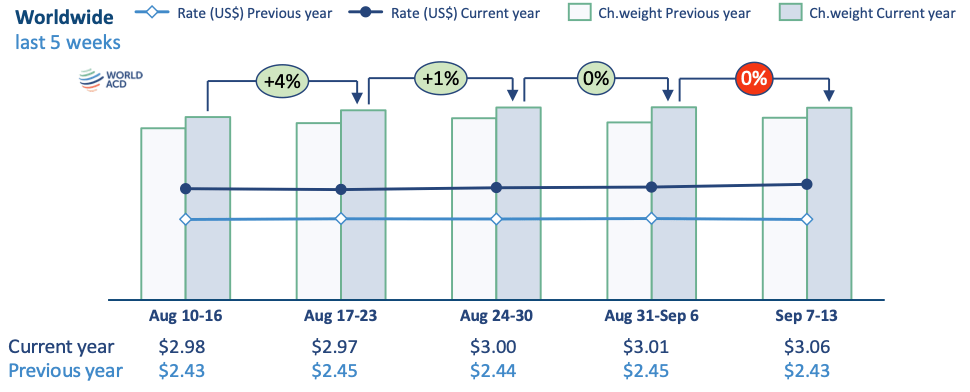
Globally, air cargo tonnages and capacity were broadly stable in the second week of September, while average rates crept back upwards with a +2 percent WoW rise, based on a mix of spot and contract rates. Worldwide average spot rates were up by +3 percent, WoW, driven largely by those increases in Asia Pacific prices, but also a +3 percent rise ex-Europe and a +2 percent WoW increase from North America origins. In demand terms, the +4 percent WoW rise in volumes from Asia Pacific origins, along with a +4 percent increase from Africa, were offset by a -14 percent drop in volumes from North America linked to annual Labor Day holidays in the US and Canada on the 7th September.
Capacity from Asia Pacific rose by +1 percent, WoW, in week 37, while there was a -3 percent WoW drop from Africa and small declines of around -1 percent from other regions. Year on year (YoY), total worldwide capacity is up by around +2 percent, with freighter capacity up +3 percent and belly capacity by just under +2 percent.
Air cargo volumes, capacity and spot rates from Asia Pacific strengthened further in the second week of September, with a rebound in Southeast Asian shipments helping to lift regional performance.
Related Post

According to the latest data from WorldACD Market Data, chargeable weight from Asia Pacific origins increased 4% week on week (WoW) in Week 37, covering 7-13 September. Average spot rates rose a further 3% to US$4.69 per kg, marking a third consecutive weekly increase.
WorldACD said the stronger regional performance was partly a rebound from national holidays in Vietnam and Malaysia during the previous week. The latest figures nevertheless point to continued resilience in Asia Pacific air cargo within an otherwise mixed but relatively stable global market.
Global Rates Edge Higher
Worldwide air cargo tonnage and capacity were broadly stable during Week 37, while average rates increased 2% week on week, based on a combination of spot and contract pricing.
Global spot rates rose 3%, supported primarily by higher prices from Asia Pacific. Spot rates from Europe increased by 3%, while North American origin rates gained 2%.
The 4% increase in Asia Pacific volumes, together with a 4% rise from Africa, was offset by a 14% decline in North American-origin tonnage. WorldACD linked the North American reduction in part to the Labor Day holiday on 7 September.
Asia Pacific capacity increased by 1% week on week, while capacity from Africa fell 3%. Capacity from most other major origin regions declined by around 1%.
On a year-on-year basis, worldwide air cargo capacity was approximately 2% higher, with freighter capacity up 3% and belly capacity increasing by just under 2%.
Southeast Asia Rebounds After Holidays
The most pronounced changes within Asia Pacific were recorded on Southeast Asian trade lanes, particularly those involving Vietnam and Malaysia.
Vietnam-Europe tonnage surged 44% week on week after falling 24% in Week 36. Malaysia-Europe volumes rebounded 19% following a 30% decline the previous week.
The transpacific market also recorded sharp reversals. Vietnam-US chargeable weight increased 24% week on week after dropping 27% in Week 36, while Malaysia-US tonnage recovered 7% after a 9% decline.
WorldACD noted that the scale of these movements broadly mirrors the seasonal pattern recorded in the same period last year, suggesting that national holidays were a significant factor behind the volatility.
Transpacific Demand Remains Strong
Asia Pacific-US traffic continued to perform strongly on a year-on-year basis, with total tonnage from the region to the US up 17% in Week 37.
Hong Kong-US volumes increased 20% year on year, reversing some of the weakness recorded during the same period last year. South Korea posted an even stronger 53% increase, supported by semiconductor and other high-tech shipments, although WorldACD noted that volumes may have been influenced by frontloading ahead of the upcoming Chuseok holiday.
Taiwan-US, Vietnam-US and Thailand-US traffic also remained positive, increasing 11%, 2% and 23%, respectively.
Other Asian markets recorded significant gains. Singapore-US volumes increased 26% year on year, while Indonesia-US traffic rose 33%.
Japan-US has also emerged as a particularly strong market. WorldACD said tonnage across the lane during the five weeks preceding Week 37 was approximately 25% higher on average than a year earlier.
China-US traffic strengthened further, with Week 37 tonnage 17% above the corresponding week in 2025.
The strength of these flows reflects continued demand for advanced technology products, including semiconductors, across the transpacific market.
China-Europe Traffic Begins to Recover
The Asia Pacific-Europe market is showing more gradual signs of stabilisation.
Regional tonnage to Europe increased 2% week on week in Week 37, although volumes remained 6% below year-earlier levels. The principal drag continues to be the Hong Kong-Europe market following the European Union’s removal of its de minimis exemption for goods valued below €150 on 1 July.
Hong Kong-Europe tonnage was down 24% year on year in Week 37, despite a further 1% week-on-week increase. The latest rise marks the fourth consecutive weekly increase, indicating that the market may be beginning to stabilise after the sharp declines recorded during July and August.
Mainland China-Europe volumes also increased by another 1% week on week, marking a sixth consecutive weekly gain. As a result, China-Europe traffic moved marginally above year-earlier levels for the first time since early July.
The recovery remains uneven, however. WorldACD’s previous weekly data showed that Hong Kong-Europe traffic had fallen sharply following the EU’s 1 July customs changes, while August volumes from Hong Kong to Europe remained well below their levels immediately before the rule change.
Gulf Capacity Remains Below Pre-Conflict Levels
Capacity across the Middle East & South Asia (MESA) region was broadly stable week on week, although Gulf markets continued to operate below pre-conflict levels.
Capacity to Europe from Gulf markets fell approximately 3% during Week 37, while capacity to North America and Africa increased by 4%. Capacity within the Gulf region itself rose 3%.
Overall MESA capacity remained approximately 8% below its Week 7 level, before the start of the US-Iran conflict.
The recovery has been more pronounced in South Asia, where capacity was approximately 3% above its mid-February level. Gulf-area capacity, however, remained around 16% below Week 7, including reductions of approximately 24% to Europe, 21% to Asia Pacific and 9% to North America.
Cargo volumes have followed a similarly uneven pattern. MESA-Europe tonnage in Week 37 was around 12% below Week 7, while Dubai-Europe volumes were almost 60% lower.
By contrast, MESA-US volumes were approximately 12% above their Week 7 level, driven primarily by strong growth from India, where tonnage increased 14%. Bangladesh also recorded a significant 58% increase, while Dubai-US volumes declined 14%.
Asia Pacific Maintains Momentum
The latest WorldACD data presents a market in which Asia Pacific continues to provide much of the momentum in global air cargo.
The rebound in Vietnam and Malaysia demonstrates the influence of holiday-related disruptions on weekly comparisons, while stronger transpacific flows point to sustained demand for technology and semiconductor products.
At the same time, the gradual recovery in China-Europe traffic suggests that the market is beginning to adjust to the EU’s new low-value import regime, although Hong Kong-Europe volumes remain significantly below last year’s levels.
With global capacity broadly stable and Asia Pacific spot rates continuing to rise, the region remains a key driver of air cargo market activity as the industry moves deeper into the second half of 2026.