
The global air cargo market delivered another year of growth in 2025, but tariffs, trade-policy changes, e-commerce disruption and geopolitical uncertainty reshaped demand across the major carriers and trade lanes.
The air cargo industry entered 2025 facing an increasingly complex operating environment. Tariff changes, the removal of US de minimis exemptions, geopolitical disruption and shifting manufacturing patterns altered established trade flows and forced carriers to continually reassess networks and capacity.
Against that backdrop, the world’s leading cargo airlines continued to grow faster than the market as a whole.
Related Post


The top 25 carriers ranked by cargo tonne-kilometres (CTK) recorded combined growth of 5.5% in 2025, compared with 3.4% for the global air cargo industry, according to the ranking data.
The wider industry figure is consistent with International Air Transport Association (IATA) data, which showed global air cargo demand increasing 3.4% year on year in 2025. Capacity rose 3.7%.
But the headline growth figure masks significant differences between carriers and regions.
Asia-Pacific airlines were the strongest performers, recording 8.4% demand growth for the year. By contrast, North American carriers recorded a 1.3% decline, the only regional contraction. European carriers grew 2.9%, while Middle Eastern airlines increased demand by just 0.3%.
The divergence reflected a fundamental change in the geography of air cargo. IATA identified a shift in traffic from the Asia-North America corridor towards Asia-Europe, driven in part by tariff pressures and the removal of US de minimis exemptions. Europe-Asia demand increased 10.3% for the year, while Asia-North America contracted 0.8%.
FedEx retains the lead
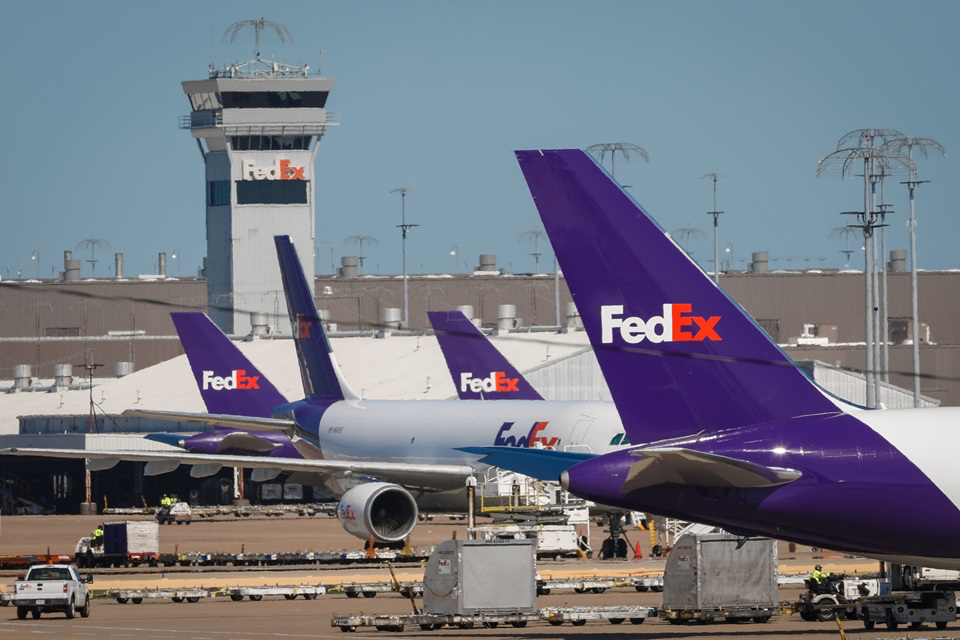
Federal Express remained the world’s largest cargo carrier by CTK in 2025, although its volume declined significantly.
FedEx recorded 16.3 billion CTK, down 9.9% year on year, according to the ranking data.
The decline came as the company continued to adjust its network to changing demand, particularly across international markets. FedEx has been pursuing its DRIVE transformation programme, which includes a redesign of its international air network and greater use of partner capacity.
The strategy is intended to align aircraft deployment more closely with the type, timing and profitability of demand.
FedEx has increasingly differentiated between time-critical priority shipments and deferred or economy services, with the latter benefiting from continued e-commerce demand.
The company’s 2025 annual report provides the underlying corporate context for the fleet and network changes during the period. FedEx continues to invest in fleet modernisation while reducing exposure to aircraft and capacity that are no longer aligned with network requirements.
At the end of fiscal 2025, FedEx had a global fleet of more than 700 aircraft, according to the company’s corporate reporting. Its current corporate information lists approximately 700 aircraft across the Federal Express operation.
The carrier also continued to place emphasis on newer, more efficient freighters, with Boeing 777Fs and 767Fs central to its fleet-modernisation strategy.
UPS closes the gap
United Parcel Service moved closer to FedEx in the rankings, recording 16.1 billion CTK and 7.2% growth to strengthen its position in second place.
UPS’s performance reflected a combination of stronger international activity and a strategic reshaping of its customer and network mix.
The company has been deliberately reducing its exposure to lower-quality and less profitable volumes, including a planned reduction of its business with Amazon. UPS said in its 2025 annual report that it expects the strategy to reduce volume from its largest customer by more than 50% by June 2026 compared with 2024 levels.
At the same time, UPS has been prioritising healthcare, international shipments and small and medium-sized businesses.
Its 2025 results showed average daily air-product volume down 11.7%, primarily because of the planned reduction in volume from its largest customer. That decline was partly offset by stronger demand from healthcare and technology customers.
International Package volumes moved in the opposite direction. Average daily international volume increased 2.5%, with export volumes rising 3.5%. UPS attributed the growth partly to stronger activity in Europe, the Middle East and Africa and increased intra-European SMB activity.
The carrier also benefited from the full-year impact of its US Postal Service air cargo agreement, which had been transitioned from FedEx.
Fleet restructuring
UPS continued to modernise its freighter fleet during the year, increasing its Boeing 767-300 fleet to 89 aircraft and ending 2025 with 18 additional 767-300s on order.
The company’s 2025 annual report also confirms that its MD-11 fleet was permanently grounded and subsequently retired during the fourth quarter. The company said it did not expect the retirement to have a material impact on its business or financial position.
The fleet transition reinforces UPS’s longer-term focus on newer, more efficient freighters and a network designed around higher-quality volumes.
Qatar Airways faces a more difficult market
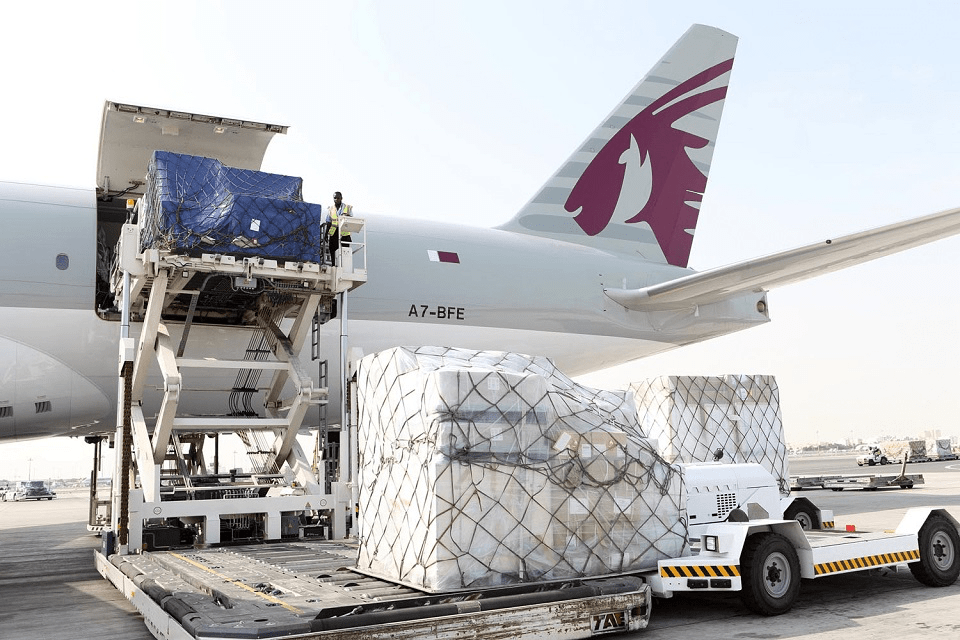
Qatar Airways slipped to third place in the ranking after its CTK volumes fell 5% to 14.4 billion.
The decline came despite Qatar Airways Cargo maintaining one of the industry’s largest international networks and continuing to invest in specialised products, partnerships and fleet.
The airline’s latest financial results show that Qatar Airways Cargo transported more than 1.43 million tonnes of chargeable freight during the 2025/26 financial year and retained a 12% share of the global international air freight market, according to the airline.
The Middle East, however, was one of the weaker regional markets in 2025. IATA recorded just 0.3% growth in demand for Middle Eastern carriers, compared with 8.4% in Asia-Pacific.
Geopolitical disruption also created additional operational complexity for carriers whose networks depend heavily on the region’s position between Asia, Europe, Africa and the Americas.
Qatar Airways responded by continuing to shift capacity between markets, expand specialised cargo services and develop strategic partnerships.
The carrier introduced services targeting sectors including semiconductors and high-technology cargo, while continuing to expand its network and freighter operations.
At the end of 2025, Qatar Airways Cargo operated a fleet of Boeing 777 freighters and remained one of the industry’s largest dedicated freighter operators.
Asia reshapes the rankings
The strongest structural theme running through the 2025 rankings was the continued importance of Asia.
IATA data shows that Asia-Pacific airlines recorded 8.4% demand growth during the year, supported by intra-Asian trade and the expansion of production and supply-chain networks across Southeast Asia.
The shift was particularly visible in the major trade lanes.
Asia-North America demand fell 0.8% for the year, while Europe-Asia increased 10.3%. Within Asia, demand grew 10%, while Middle East-Asia increased 5.8%.
That redistribution benefited carriers with extensive Asian networks and the flexibility to redeploy aircraft as trade flows changed.
Air China was among the major gainers in the ranking, increasing CTK by 23.4% to 9.1 billion and moving three places higher.
The carrier’s growth reflected increased cargo activity across its international network and additional belly capacity generated by the expansion of its passenger operation.
China’s role in the global air cargo market remained substantial despite the disruption to China-US e-commerce flows. Airlines increasingly looked towards Europe, Southeast Asia and intra-Asian markets to replace or rebalance lost transpacific demand.
Fewer dramatic changes at the top
While the overall ranking remained relatively stable, several carriers changed position as trade patterns evolved.
Korean Air, Kalitta Air and British Airways each moved down three places, while Air China gained three positions and China Eastern Airlines rose two.
All Nippon Airways dropped out of the top 25 after having ranked 24th in 2024.
The Japanese carrier was affected by weaker China-North America demand and softer automotive and e-commerce cargo flows, although it sought to compensate through capacity redeployment elsewhere in Asia.
The changing rankings illustrate how quickly the competitive environment can shift when trade lanes move.
Carriers with flexible fleets, diversified networks and access to fast-growing Asian markets were better positioned to capture emerging demand.
E-commerce remains a major driver
E-commerce continued to underpin air cargo growth in 2025, although the pattern of that growth changed substantially.
The removal of the US de minimis exemption for certain low-value shipments and the introduction of new tariffs altered the economics of China-US e-commerce shipments.
IATA said the resulting trade-policy changes contributed to a shift in air cargo flows away from Asia-North America and towards Asia-Europe.
The industry nevertheless continued to benefit from the structural demand for fast delivery and the increasing use of airfreight for time-sensitive and high-value goods.
For express carriers, the challenge was increasingly one of yield and network quality rather than simply volume growth.
FedEx and UPS both responded by adjusting their networks, consolidating operations and placing greater emphasis on higher-value traffic.
A year of adaptation
The 2025 rankings ultimately demonstrate that scale alone was not enough to guarantee growth.
The global air cargo market expanded at a more moderate rate than in 2024, when demand increased 11.3%, but the underlying market remained resilient. IATA described the 2025 performance as a move towards more normalised growth, with e-commerce, supply-chain reconfiguration and demand for time-critical transport supporting volumes.
Asia-Pacific emerged as the principal growth engine, while North America faced greater pressure. Meanwhile, major trade lanes were being reshaped by tariffs, customs policy and changing manufacturing patterns.
For the leading cargo airlines, the response was clear: capacity had to become more flexible, networks more adaptable and fleet strategies more closely aligned with changing demand.
The result was a ranking shaped not simply by how much cargo airlines carried, but by how effectively they adapted to where that cargo was moving.