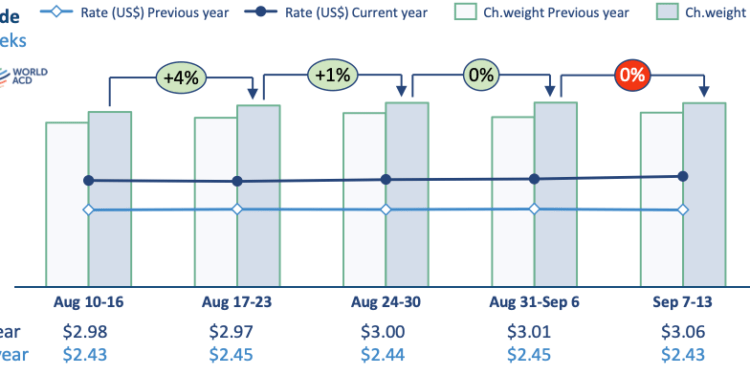


Global air cargo demand increased 4.4% year on year in August 2026, while available capacity edged lower, according to the latest figures from the International Air Transport Association (IATA).
Total demand, measured in cargo tonne-kilometres (CTK), increased 4.4% compared with August 2025, while international CTK rose 5.3%. Available cargo tonne-kilometres (ACTK) declined 0.1% year on year, although international capacity increased 0.1%.
The combination of stronger demand and slightly reduced overall capacity lifted the global cargo load factor by 2.0 percentage points to 46.0%.
Related Post


“Air cargo demand rose 4.4% year-on-year in August with all regions reporting growth even as capacity was trimmed by 0.1%,” said Marie Owens Thomsen, IATA’s Senior Vice President Sustainability and Chief Economist.
“Strong demand and higher load factors helped airlines to recoup some of the exceptionally high fuel costs. Yields rose month-on-month for the first time since April, while global goods trade growth continues. Both are positive signs as the year-end peak season comes into view.”
Trade and manufacturing support demand
The wider economic environment remained supportive of air freight demand in August.
Global trade increased 6.0% year on year in July, extending the period of consecutive annual growth to 33 months. Global manufacturing activity also strengthened in August, with the Global Manufacturing Output Purchasing Managers’ Index (PMI) increasing 0.3 points to 53.0.
The New Export Orders Index rose 1.4 points to 51.4, with both indicators remaining above the 50-point threshold and providing support for air cargo demand.
Fuel costs, however, continued to put pressure on airline economics. Jet fuel prices increased 8.3% month on month in August and were 79.2% higher than a year earlier, according to IATA.
North America leads regional growth
North American carriers recorded the strongest year-on-year growth among the regions, with demand increasing 6.6%in August. Capacity fell 2.5%, resulting in a 3.6-percentage-point increase in the regional cargo load factor to 42.0%.
Latin American and Caribbean carriers recorded 5.1% demand growth, with capacity increasing 3.3%.
Asia-Pacific airlines reported a 4.3% increase in demand and a 1.2% rise in capacity, while European carriers saw demand grow 4.1% against a 3.5% reduction in capacity.
African airlines recorded 3.0% demand growth, accompanied by a substantial 14.0% increase in capacity. Middle Eastern carriers recorded the slowest regional demand growth at 1.0%, while capacity increased 3.3%.
| Region | Demand (CTK) | Capacity (ACTK) |
|---|---|---|
| North America | +6.6% | -2.5% |
| Latin America & Caribbean | +5.1% | +3.3% |
| Asia-Pacific | +4.3% | +1.2% |
| Europe | +4.1% | -3.5% |
| Africa | +3.0% | +14.0% |
| Middle East | +1.0% | +3.3% |
Asia-North America remains strongest trade lane
Trade-lane performance remained uneven during August.
The Asia-North America corridor recorded the strongest growth, with CTKs up 13.2% year on year. Traffic within Asia increased 6.1%, while Europe-North America rose 4.3% and Europe-Asia grew 3.1%.
The Asia-North America corridor has now recorded seven consecutive months of growth, while traffic within Asia has expanded for 34 consecutive months. Europe-Asia has also continued to grow, with August marking the 42nd consecutive month of expansion.
By contrast, several Gulf-linked routes remained under pressure amid disruption associated with the conflict in the Middle East. Europe-Middle East traffic declined 12.1%, Middle East-Asia fell 11.0%, and Africa-Asia decreased 11.9%.
IATA said the air cargo market therefore continued to show significant divergence between major trade lanes despite overall global growth.
Capacity discipline supports load factors
The August figures indicate that demand growth continued to outpace capacity growth at the global level.
The 0.1% reduction in ACTK was driven in part by capacity reductions among North American and European carriers, which outweighed additional capacity deployed elsewhere. The resulting improvement in load factors helped offset some of the pressure created by significantly higher jet fuel prices.
With global trade continuing to expand and manufacturing and export-order indicators remaining supportive, IATA said the market was entering the year-end peak season against a backdrop of continued demand growth.
At the same time, elevated fuel prices and geopolitical disruption remain significant factors for airlines as they manage capacity and network decisions.