

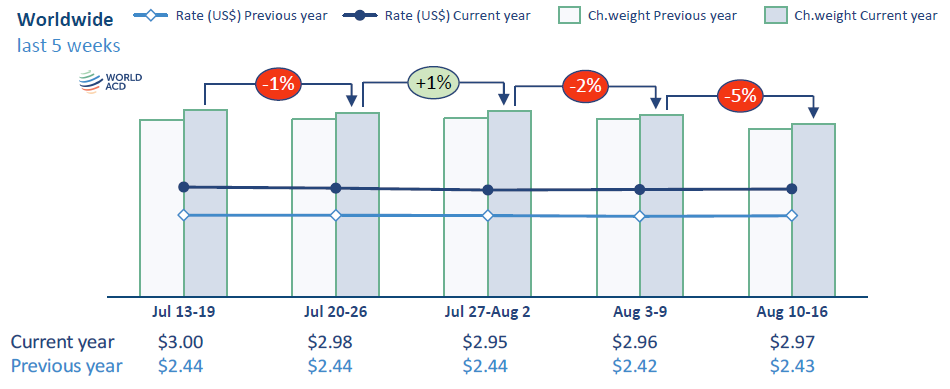
Global air cargo traffic declined for a second consecutive week in mid-August, with chargeable weight falling 5% week on week as seasonal factors, weaker demand on several major trade lanes and reduced capacity weighed on the market.
The latest WorldACD figures, covering the week from August 10 to 16, show tonnage falling across almost all major origin regions. Europe and Asia Pacific recorded the steepest declines, both down 6%, followed by Africa at -5%. Middle East & South Asia (MESA) and North America each recorded a 4% contraction.
Central & South America (CSA) was the exception, with chargeable weight increasing 2%, supported by stronger flower exports.
Related Post

The latest decline follows a 2% global week-on-week contraction in week 32. On a two-week comparison, worldwide chargeable weight was down 4%, with most major trade lanes also recording lower volumes.
Asia Pacific was particularly weak, with intra-regional traffic falling 10% over the two-week period. Volumes from the region to Europe, North America and MESA declined by between 3% and 5%. MESA traffic to Europe fell 10%, while flows to Asia Pacific dropped 8%.
Despite the recent contraction, global chargeable weight remained 3% above the corresponding week of 2025. Growth ranged from 1% out of Africa and Asia Pacific to 5% from Europe and 6% from MESA.
Asia-Europe and Asia-US markets move in opposite directions
The divergence between the Asia-Europe and Asia-US markets has become increasingly pronounced.
Chargeable weight from Asia Pacific to the US fell another 4% week on week, following a 3% decline the previous week. Japan recorded the largest fall, with volumes down 33%, as the Obon holiday and tropical storm Chan-Hom disrupted flight operations and caused cancellations at Tokyo’s Haneda and Narita airports.
South Korea was the only major Asia Pacific origin to record growth on the US lane, with tonnage increasing 12%. Vietnam was broadly flat, while most other origins registered declines of between 1% and 6%. Indonesia was a notable exception, falling 14%.
Asia Pacific exports to Europe declined 5% week on week, with Japan again recording the sharpest contraction at 53%. Malaysia, Taiwan and Indonesia were the only origins in the region to record growth, while Singapore fell 10% and Hong Kong declined 1%.
Europe-bound traffic from Asia Pacific has now recorded week-on-week declines in almost every week since late June. By contrast, the US market has remained considerably stronger.
On a year-on-year basis, Asia Pacific chargeable weight to Europe was down 14% in week 33, while traffic to the US increased 14%.
The disparity reflects, in part, the sharp reduction in e-commerce flows from Hong Kong and mainland China to Europe following the end of the European Union’s de minimis exemption for low-value imports. At the same time, demand associated with artificial intelligence-related supply chains has continued to support Asia-US airfreight volumes.
MESA traffic also shows contrasting trends
MESA exports to Europe fell 3% week on week. A 12% increase from Dubai was outweighed by declines from Bangladesh, Sri Lanka and India, which fell 13%, 5% and 3%, respectively.
Traffic from MESA to the US was considerably weaker, declining 13%. Bangladesh recorded a 29% fall, while India was down 13%.
Year-on-year comparisons show a similar divergence. MESA exports to Europe were down 5%, despite India recording 12% growth. By contrast, traffic to the US was 16% higher than a year earlier, with India’s 29% increase offsetting declines from other origins.
Falling capacity helps support rates
Despite the decline in traffic, global airfreight pricing remained broadly stable.
The average worldwide rate edged up from US$2.96 to $2.97, effectively unchanged on both a week-on-week and two-week basis. Rising aviation fuel costs, combined with a further reduction in available capacity, helped offset the impact of weaker demand.
Global capacity declined 1% week on week, marking the second consecutive weekly contraction and the third such decline in the past four weeks.
Asia Pacific capacity fell 2%, while Europe, North America and CSA each recorded 1% reductions. MESA and Africa moved in the opposite direction, with capacity increasing 2% and 1%, respectively.
Rates from North America and MESA fell 2% week on week, while CSA was unchanged. Pricing increased 1% from Europe and 2% from both Africa and Asia Pacific.
Year on year, rates remained significantly higher across the main origin regions, with increases ranging from 18% to 23%, excluding MESA, where pricing was up 47%, and CSA, where it increased 8%.
On the Asia Pacific-US trade lane, spot rates edged up 1% week on week. Most origins recorded little movement, although Indonesia rose 12%, while Thailand, Vietnam and South Korea recorded declines.
Asia Pacific-Europe spot rates were flat overall. Changes by origin ranged from a 4% decline to a 2% increase, with Japan again the outlier, recording a 16% fall.
MESA spot rates declined 1% to the US and 2% to Europe. Rates from Sri Lanka to the US increased 5%, while those from India and Dubai declined 1% and 2%, respectively.
Year on year, MESA pricing remained substantially higher, increasing 54% to Europe and 56% to the US.
Market could rebound after mid-August slowdown
The latest figures bear similarities to the pattern seen at the same point last year, when air cargo tonnage declined by mid-single-digit percentages while capacity remained relatively stable and rates edged higher.
If the seasonal pattern repeats, traffic could rebound in week 34 as the impact of the mid-August holiday period fades.
However, WorldACD cautioned that the current market remains volatile, with trade policy changes, shifting e-commerce flows, fuel prices and geopolitical developments continuing to influence both demand and capacity.
The latest data therefore points to a softer late-summer air cargo market, but not necessarily a structural deterioration in demand. Year-on-year volumes and rates remain positive, while the divergence between major trade lanes continues to reshape where capacity is being deployed.